Explore Desviación Estándar’s Significance in Understanding Statistical Variability
Desviación Estándar: An Overview
What is Desviación Estándar?
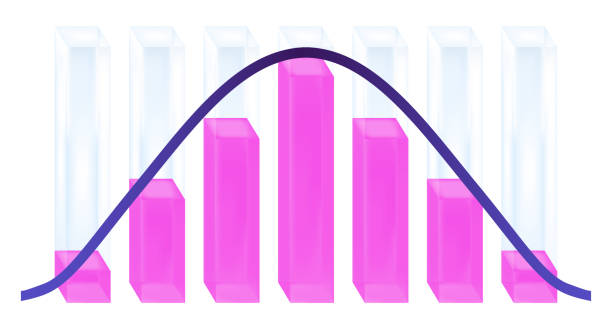
Desviación Estándar, or Standard Deviation in English, is a statistical measure that indicates the amount of variation or dispersion in a set of values. A low standard deviation indicates that the values tend to be close to the mean, while a high standard deviation suggests a wider range of values.
Historical Background
Dating back centuries, the concept has been a foundational stone in statistics. Renowned mathematicians and statisticians have tweaked and refined the idea, making it more robust and applicable to various data sets.
Importance in Statistics
Why it’s Central to Data Analysis
In any data analysis, understanding variability is key. Desviación Estándar helps in quantifying the uncertainty and unpredictability in datasets, making it easier to draw meaningful conclusions.
Applications in Real World
From market research to healthcare diagnostics, the applications are endless. Whether determining the consistency of a product’s quality or predicting stock market trends, Desviación Estándar offers insights that are invaluable.
Understanding the Math
Basic Formula
The formula might seem daunting at first glance, but with a little practice, it becomes second nature. It’s essentially the square root of variance, another statistical measure.
Calculation Process
Imagine you’ve got a set of numbers. You’d first determine the mean, then subtract each value from this mean, square the result, and finally compute the average of these squared differences. Voila! The square root of this average gives you the Desviación Estándar.
Differences & Similarities
Compared to Mean and Mode
While mean gives an average and mode identifies the most frequent value, Desviación Estándar quantifies the spread. Each of these measures offers a unique perspective on data.
Difference from Variance
Variance and Desviación Estándar are closely related, with the latter being the square root of the former. However, while variance provides a squared measure, Desviación Estándar is more intuitive as it’s in the original unit of data.
In Practical Terms
Everyday Examples
Think of student grades. If most students in a class score near the average, the Desviación Estándar is low. But if grades are all over the map, it’s higher.
Impact on Business Decisions
In business, understanding variability can mean the difference between a successful product launch and a flop. By understanding the Desviación Estándar, companies can gauge market reactions and tailor their strategies.
Desviación Estándar in Financial World
Investment & Risk Management
Investors use this measure to understand the volatility of stock returns. A higher Desviación Estándar indicates a more unpredictable stock, potentially leading to bigger gains or losses.
Portfolio Diversification
In the quest to balance risk and return, Desviación Estándar aids in selecting a mix of assets that can potentially optimize returns while minimizing potential downsides.
Tools & Software
Popular Tools for Calculation
While the manual calculation is educational, various software solutions, like Excel or specialized statistical software, can expedite the process.
Advantages of Using Tools
Besides speed, these tools also offer accuracy, ensuring that human errors don’t skew the results.
Common Mistakes
Misinterpretation & Misuse
Just like any tool, Desviación Estándar is only as good as its user. Misunderstanding its value can lead to erroneous conclusions.
How to Avoid Common Pitfalls
Always ensure you’re applying the measure correctly and interpreting results within context. Continuous learning and practice are your best allies.
Desviación Estándar in Research
Role in Scientific Studies
In clinical trials or scientific experiments, Desviación Estándar helps in understanding the reliability and repeatability of results.
Impact on Research Conclusions
A small Desviación Estándar can often strengthen the findings of a study, indicating consistent results across samples.
FAQs
– How is Desviación Estándar different from average?
While average gives a central value, Desviación Estándar talks about the spread or dispersion of data around this central value.
– Why is Desviación Estándar important in finance?
It helps in gauging the risk associated with financial instruments, aiding in informed decision-making.
– Can Desviación Estándar be negative?
No, since it’s derived from squared values, it’s always non-negative.
– Is a high Desviación Estándar always bad?
Not necessarily. It depends on context. In some scenarios, more variability might be desirable.
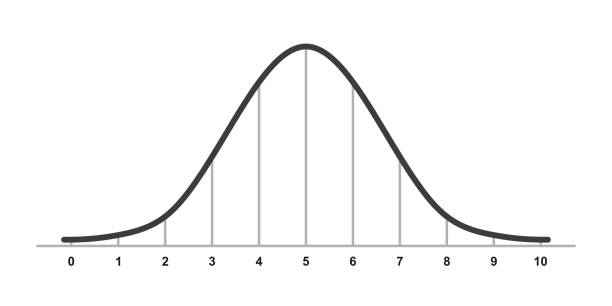
– How is it related to bell curves or normal distribution?
In a bell curve, about 68% of data falls within one Desviación Estándar from the mean. This percentage increases as you consider more standard deviations.
– Do all fields use Desviación Estándar in the same way?
The core concept remains consistent, but its application and interpretation can vary based on the field.
Conclusion
Desviación Estándar, while a mouthful to say, is a powerful and versatile statistical measure. Whether you’re diving into the world of finance, embarking on scientific research, or just trying to make sense of data in everyday life, understanding this measure can offer invaluable insights. Like any tool, its strength lies not just in its design but in the hands of its user.
External Links/ Sources: